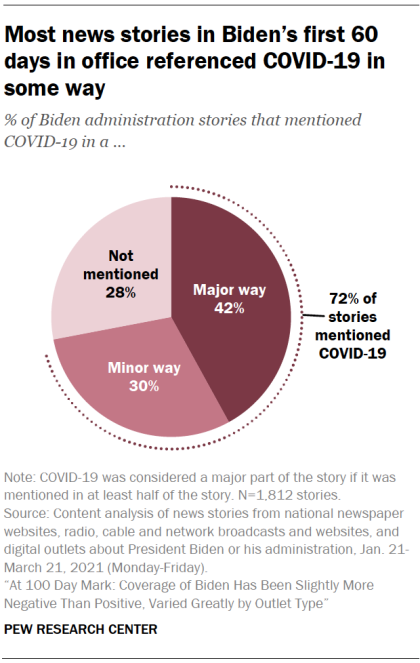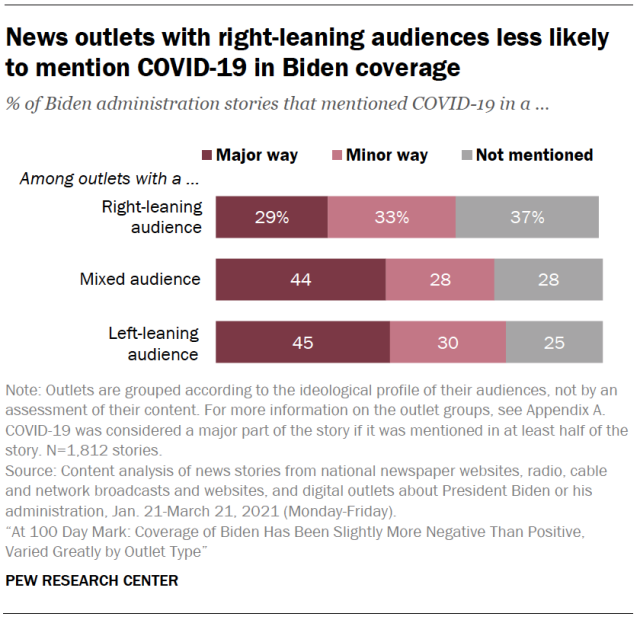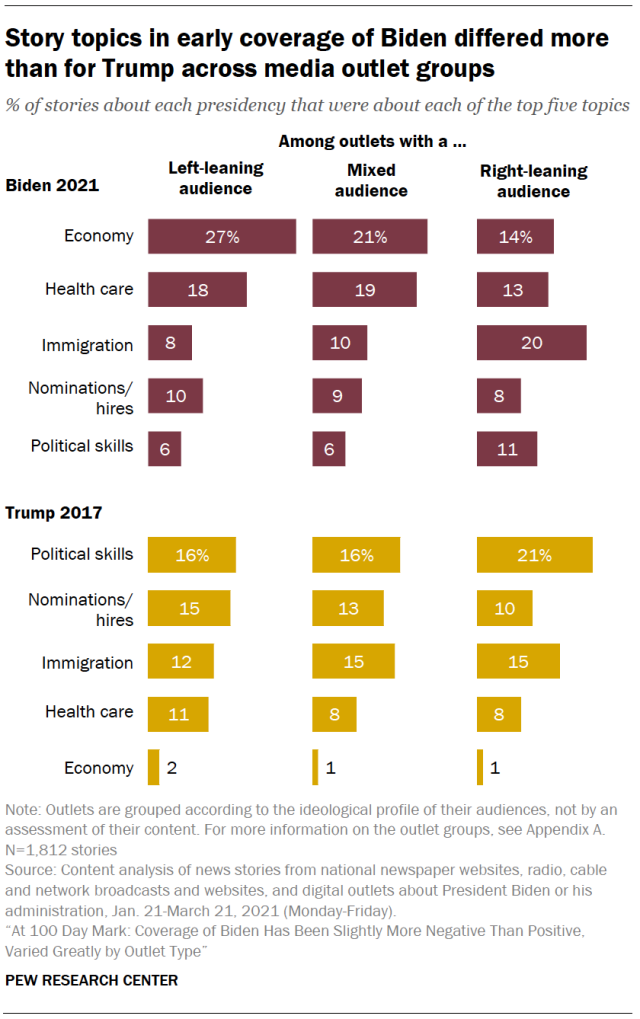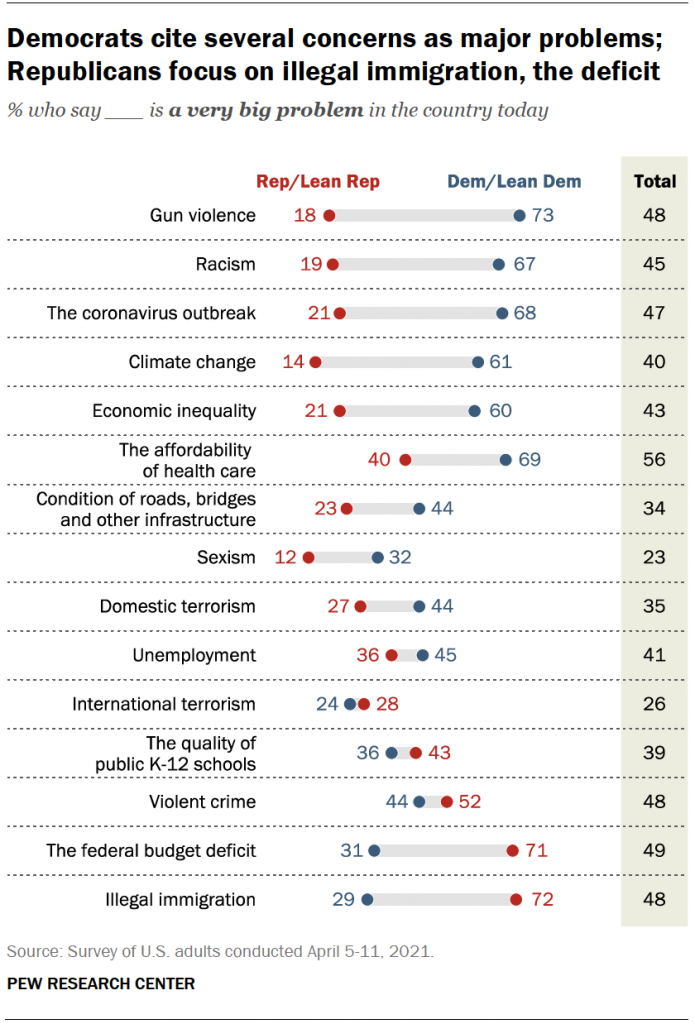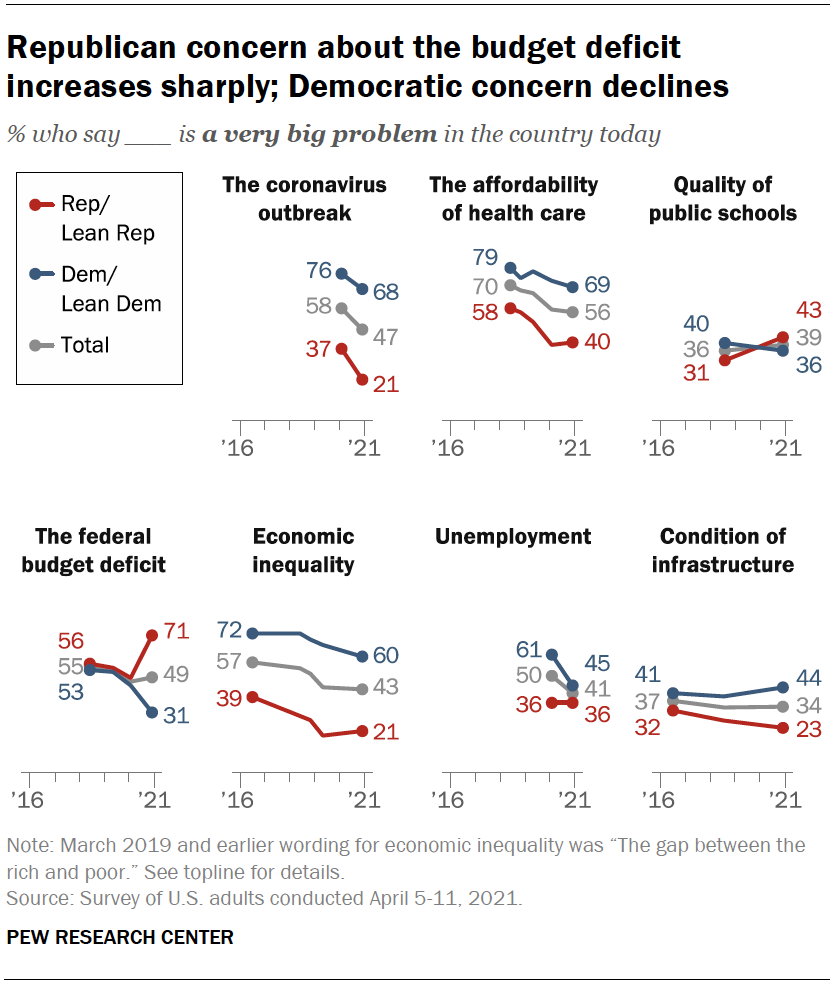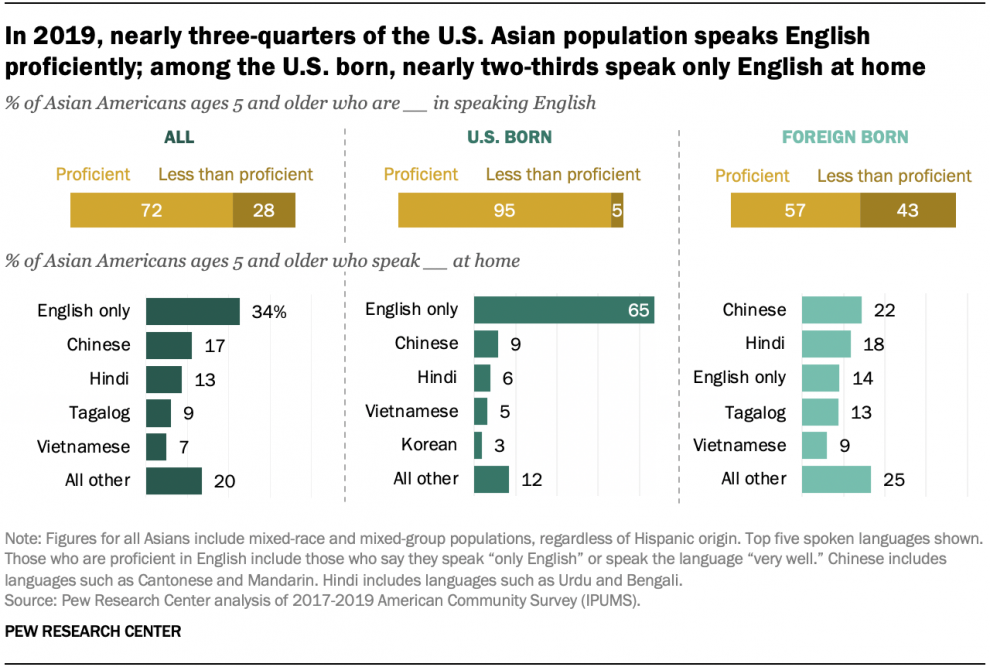
Data storytelling is the way of understanding complicated data, it involves ‘deep-analysis’ and presenting them in a visual manner which can be easily understood by the target audience.
Below is a list of most amazing “Storytelling Data Charts” from “Pew Research Center” which can be a true inspiration for professionals on “Data Analytics, Data Visualization and Designers”.